2025 Mid-Year ADA Website Lawsuit Report
Lawsuits Surge 37% in the first half of 2025 as Litigation Expands Across States and Industries

Executive Summary

Lawsuit Volume Rising
2,014 lawsuits filed in the first half of 2025, up 37% year-over-year, reflecting intensified scrutiny of digital compliance.

Shifting State Trends
New York, Florida, and California remain hotspots, but Illinois surged dramatically, emerging as a new litigation hub.

Repeat Filers Dominate
The top 31 plaintiffs and top 16 law firms drove the vast majority of cases, showing concentrated filing patterns.

All Platforms at Risk
Lawsuits hit Shopify, WordPress, Magento, Squarespace, Salesforce Commerce Cloud, and custom-coded sites alike — proving no platform is immune.

Global Pressure Mounts
With the European Accessibility Act, India’s SEBI mandates, and Los Angeles’s Olympic accessibility commitment, international momentum is reshaping the digital accessibility landscape.
State-Wise ADA Website Lawsuits Filed
Litigation remains concentrated but shifting. While New York still leads, Florida nearly doubled its filings, California rose, and Illinois exploded by more than 745% compared to 2024.
| State Wise - Total ADA Lawsuits Filed | Total Lawsuits | Percentage | January | February | March | April | May | June |
|---|---|---|---|---|---|---|---|---|
| New York | 637 | 31.63% | 128 | 127 | 121 | 86 | 109 | 66 |
| Florida | 487 | 24.18% | 62 | 57 | 113 | 78 | 106 | 71 |
| California | 380 | 18.87% | 44 | 56 | 56 | 82 | 79 | 63 |
| Illinois | 237 | 11.77% | 41 | 42 | 35 | 37 | 53 | 29 |
| Minnesota | 84 | 4.17% | 11 | 12 | 16 | 17 | 14 | 14 |
| Missouri | 48 | 2.38% | 11 | 3 | 0 | 9 | 10 | 15 |
| Pennsylvania | 47 | 2.33% | 4 | 20 | 0 | 1 | 2 | 20 |
| All Other States | 94 | 4.67% | 17 | 19 | 21 | 11 | 15 | 11 |
| Total ADA Lawsuits Filed | 2014 | 100% | 318 | 336 | 362 | 321 | 388 | 289 |
New York led all states with 637 lawsuits, accounting for 31.63% of the total filings. It continues to be the most litigious state for ADA website accessibility, with consistent monthly case volumes throughout the six-month period.
Florida followed with 487 lawsuits (24.18%), remaining a key hotspot for accessibility litigation. Notably, filings surged in March and remained high through May.
California, long known for its ADA activity, recorded 380 lawsuits (18.87%), with a relatively even distribution across the months. Los Angeles County alone accounted for a significant majority of these cases, continuing to make it the most targeted region within the state.
Illinois stood out with 237 filings (11.77%), solidifying its position among the top four states. The state’s continued upward trend reflects the persistence of local plaintiff activity and firm-level focus.
Minnesota, with 84 lawsuits (4.17%), continued its rise as an emerging ADA litigation state following recent legal developments. Its presence on the top list is a strong indicator of expanding geographic trends.
Missouri and Pennsylvania saw 48 and 47 lawsuits, respectively, each contributing just over 2% of total filings.
All other states combined contributed 94 lawsuits (4.67%), showing that ADA website compliance risks are no longer confined to just a few states.
Hidden Litigation Pressure: Demand Letters
While not trackable in public records, demand letters are quietly increasing — often used to pressure businesses into quick settlements. Reports show they are especially common in Pennsylvania, and in California many are never filed with the state despite legal requirements. This “shadow litigation” adds significant risk beyond the lawsuits counted in this report.

State-Wise Comparison of ADA Website Lawsuits Mid Year 2025 vs. 2024
The comparative chart highlights significant shifts in ADA website accessibility litigation across key U.S. states for the first half of 2025 versus the same Jan to June period in 2024.
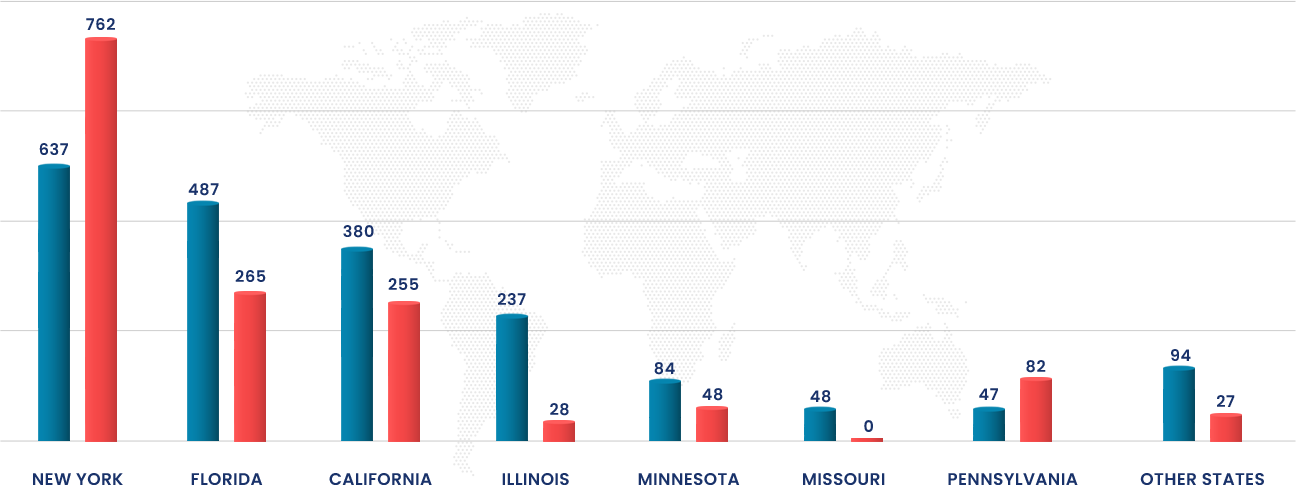
Bar chart comparing ADA website lawsuits filed in the first half of 2025 (blue bars) versus 2024 (red bars) across various U.S. states. New York and Pennsylvania show a decrease in lawsuits in 2025. In contrast, all other listed states — Florida, California, Illinois, Minnesota, Missouri, and “Other States” — experienced an increase in lawsuits.
New York remained the leading state for ADA lawsuits, but experienced a notable decline from 762 in 2024 to 637 in 2025, signaling a reduction of 125 cases.
Florida showed a major surge, climbing from 265 cases in 2024 to 487 in 2025, nearly doubling its volume and surpassing California to become the second most litigious state.
California also saw an increase in filings, rising from 255 to 380 cases, maintaining its position among the top three states.
Illinois emerged as a major litigation hotspot in 2025, with lawsuits soaring from just 28 to 237 — a more than 745% increase. This dramatic rise suggests a concentrated push by specific law firms and plaintiffs targeting businesses in the state, signaling a significant shift in ADA enforcement trends. Illinois is now firmly positioned among the top four states for digital accessibility lawsuits.
Minnesota saw almost double growth, from 48 to 84 cases, continuing its steady presence on the litigation map.
Missouri recorded 0 lawsuits in the first half of 2024, but experienced a rise to 48 lawsuits in the first half of 2025. This marks a notable increase in ADA-related legal activity in the state.
Pennsylvania, on the other hand, saw a sharp decrease, dropping from 82 in 2024 to just 47 in 2025 but this doesn’t take into account the demand letters sent by attorneys in that state.
All Other States combined experienced a marked rise, from 27 to 94 lawsuits, showing that ADA litigation is gradually spreading beyond the traditionally targeted states. These shifts indicate evolving regional focus areas and expanding enforcement, particularly in states like Florida, Illinois, and Minnesota, which are now seeing substantial increases in litigation volume.
These shifts indicate evolving regional focus areas and expanding enforcement, particularly in states like Florida, Illinois, and Minnesota, which are now seeing substantial increases in litigation volume.
50% of ADA Website Lawsuits were Filed by 31 Plaintiffs Jan - June 2025
From January to June 2025, a total of 2,014 ADA website accessibility lawsuits were filed, with 188 plaintiffs driving this legal activity.
Just 31 plaintiffs were responsible for filing over 50% of these lawsuits — a pattern consistent with previous years where a small number of highly active filers dominate ADA litigation.
| Plaintiff Name | Firm Name | Total Lawsuits | Percentage | January | February | March | April | May | June |
|---|---|---|---|---|---|---|---|---|---|
| Michael Sandoval | Manning Law, APC | 114 | 5.66% | 16 | 11 | 36 | 26 | 20 | 5 |
| Julie Dalton | Throndset Michenfelder Law Office, LLC | 74 | 3.67% | 8 | 10 | 16 | 13 | 14 | 13 |
| Perla Mageno | Manning Law, APC | 55 | 2.73% | 8 | 13 | 4 | 21 | 3 | 6 |
| Rebecca Castillo | Manning Law, APC | 52 | 2.58% | 5 | 12 | 7 | 11 | 9 | 8 |
| Robert Glen Myers | ADA Legal Team, LLC | 48 | 2.38% | 11 | 3 | 0 | 9 | 10 | 15 |
| Victor Ariza | Roderick V. Hannah, Esq., P.A. | 44 | 2.18% | 3 | 5 | 11 | 7 | 12 | 6 |
| Nicholas Pagan | Alberto R. Leal, Esq., P.A. | 42 | 2.09% | 7 | 8 | 12 | 8 | 7 | 0 |
| Oscar Herrera | Roderick V. Hannah, Esq., P.A. | 37 | 1.84% | 10 | 0 | 12 | 11 | 2 | 2 |
| Yudy Hernandez | Adams & Associates, P.A. | 36 | 1.79% | 4 | 7 | 5 | 5 | 9 | 6 |
| Abdurazak Abdu | Equal Access Law Group, PLLC | 35 | 1.74% | 0 | 0 | 12 | 10 | 9 | 4 |
| Nelson Fernandez | Roderick V. Hannah, Esq., P.A. | 32 | 1.59% | 9 | 10 | 5 | 2 | 4 | 2 |
| Mykayla Fagnani | Gottlieb & Associates | 28 | 1.39% | 6 | 12 | 0 | 0 | 0 | 10 |
| Chelette Dewees | AJG Law Group, PC | 28 | 1.39% | 0 | 0 | 0 | 8 | 9 | 11 |
| Joshua Espinal | Equal Access Law Group, PLLC | 27 | 1.34% | 0 | 0 | 8 | 9 | 6 | 4 |
| Andre Battle | Horowitz Law, PLLC | 26 | 1.29% | 3 | 9 | 6 | 1 | 4 | 3 |
| Jacqueline Fernandez | Stein Saks, PLLC | 25 | 1.24% | 10 | 0 | 5 | 5 | 5 | 0 |
| Enrique Alvear | Roderick V. Hannah, Esq., P.A. | 24 | 1.19% | 0 | 13 | 0 | 0 | 1 | 10 |
| Henry Tucker | Gottlieb & Associates | 23 | 1.14% | 14 | 2 | 0 | 4 | 2 | 1 |
| Camille Winfield-Newton | AJG Law Group, PC | 23 | 1.14% | 0 | 3 | 0 | 7 | 5 | 8 |
| Edery Herrera | Gottlieb & Associates | 23 | 1.14% | 0 | 2 | 14 | 1 | 3 | 3 |
| Zephyrin Victor | Aleksandra Kravets, Esq. P.A. | 22 | 1.09% | 3 | 3 | 2 | 4 | 7 | 3 |
| Makeda Evans | Aleksandra Kravets, Esq. P.A. | 22 | 1.09% | 6 | 2 | 5 | 2 | 2 | 5 |
| Blair Douglass | East End Trial Group LLC | 22 | 1.09% | 0 | 0 | 0 | 0 | 2 | 20 |
| Jonathan Drummond | Aleksandra Kravets, Esq. P.A. | 21 | 1.04% | 5 | 1 | 3 | 0 | 6 | 6 |
| Debbie Pittman | Equal Access Law Group, PLLC | 21 | 1.04% | 0 | 0 | 3 | 6 | 9 | 3 |
| Andree Campbell | Aleksandra Kravets, Esq. P.A. | 19 | 0.94% | 2 | 3 | 3 | 4 | 2 | 5 |
| Felipe Fernandez | Stein Saks, PLLC | 19 | 0.94% | 0 | 1 | 7 | 0 | 5 | 6 |
| Laurence Wills | Stein Saks, PLLC | 19 | 0.94% | 0 | 5 | 0 | 3 | 5 | 6 |
| Lisa Cantwell | Stein Saks, PLLC | 19 | 0.94% | 0 | 3 | 2 | 2 | 12 | 0 |
| Jennifer Carbine | Manning Law, APC | 18 | 0.89% | 2 | 4 | 0 | 2 | 2 | 8 |
| Alfred Trippett | Gabriel A. Levy, P.C. | 18 | 0.89% | 9 | 7 | 0 | 0 | 1 | 1 |
| 31 Plaintiffs Filed 50.45% ADA Lawsuits From Jan to Jun 2025 | 1016 | 50.45% | 141 | 149 | 178 | 181 | 187 | 180 | |
| 157 Plaintiffs Collectively Filed 49.55% ADA Lawsuits From Jan to Jun 2025 | 998 | 49.55% | 177 | 187 | 184 | 140 | 201 | 109 | |
| 188 Plaintiffs Filed 2014 Website ADA Lawsuits From Jan to Jun 2025 | 2014 | 100% | 318 | 336 | 362 | 321 | 388 | 289 | |
Top 5 Plaintiffs
Lawsuits: 343
Percentage: 17.03%
Top 10 Plaintiffs
Lawsuits: 537
Percentage: 26.66%
Top 20 Plaintiffs
Lawsuits: 796
Percentage: 39.52%
Top 50 Plaintiffs
Lawsuits: 1308
Percentage: 64.95%
Key Highights:
- Michael Sandoval (Manning Law, APC) led all plaintiffs with 114 lawsuits, accounting for 5.66% of total filings.
- Julie Dalton (Thornsdedt Michenfelder Law Office, LLC) filed 74 lawsuits (3.67%), maintaining consistent monthly filings.
- Perla Mageno and Rebecca Castillo, both represented by Manning Law, APC, filed 55 and 52 lawsuits respectively, contributing significantly to the firm’s total.
- Robert Glen Myers (ADA Legal Team, LLC) filed 48 lawsuits (2.38%), with a sharp increase in May and June.
- Victor Ariza and Oscar Herrera (Roderick V. Hannah, Esq., P.A.) filed 44 and 37 lawsuits respectively, highlighting this firm’s active involvement.
- Nicholas Pagan (Alberto R. Leal, Esq., P.A.) filed 42 lawsuits, with a strong start in Q1.
- Yudy Hernandez (Adams & Associates, P.A.) filed 36 lawsuits, showing consistent filings across the months.
- Abdurazak Abdu and Joshua Espinal (Equal Access Law Group, PLLC) filed 35 and 27 lawsuits respectively, keeping this firm in the top 15.
- Mykayla Fagnani and Henry Tucker (Gottlieb & Associates) both filed 28 lawsuits, contributing to the firm’s broader plaintiff pool.
- Chellete Dewees and Camille Winfield-Newton (AJG Law Group, PC) filed 28 and 23 lawsuits respectively, making them among the more active plaintiffs.
- New Names in 2025: Several plaintiffs like Andre Battle, Enrique Alvear, and Zephyrin Victor entered the lawsuit landscape with over 20 filings each, signaling emerging litigation trends.
- Top 157 Plaintiffs were responsible for 49.55% of all filings (998 lawsuits), while 31 high-frequency plaintiffs accounted for the remaining 50.45% (1,016 lawsuits).
- In total, 188 unique plaintiffs filed 2,014 ADA website lawsuits in the first half of 2025.
57% of ADA Website Lawsuits Filed by 5 Law Firms (Jan–Jun 2025)
The first half of 2025 confirms a persistent pattern in ADA website litigation: a small number of law firms continue to dominate the legal landscape, aggressively filing lawsuits on behalf of a limited group of plaintiffs. Out of the 2,014 total lawsuits filed during this period, just 16 firms were responsible for over 90% of the cases — highlighting the high concentration and repeat behavior that continues to define this space.
| Plaintiff Firm Name | Total Lawsuits | Percentage | January | February | March | April | May | June |
|---|---|---|---|---|---|---|---|---|
| Manning Law, APC | 287 | 14.25% | 39 | 52 | 51 | 64 | 46 | 35 |
| Gottlieb & Associates | 265 | 13.16% | 56 | 50 | 51 | 46 | 33 | 29 |
| Equal Access Law Group, PLLC | 248 | 12.31% | 0 | 26 | 72 | 68 | 65 | 17 |
| Stein Saks, PLLC | 211 | 10.48% | 19 | 51 | 38 | 19 | 57 | 27 |
| Roderick V. Hannah, Esq., P.A. | 137 | 6.80% | 22 | 28 | 28 | 20 | 19 | 20 |
| NYE Stirling, Hale & Miller, LLP | 99 | 4.92% | 21 | 31 | 13 | 4 | 13 | 17 |
| Aleksandra Kravets, Esq. P.A. | 89 | 4.42% | 16 | 11 | 16 | 10 | 17 | 19 |
| Throndset Michenfelder Law Office, LLC | 84 | 4.17% | 11 | 12 | 16 | 17 | 14 | 14 |
| AJG Law Group, PC | 72 | 3.57% | 1 | 4 | 0 | 17 | 22 | 28 |
| Asher Cohen PLLC | 67 | 3.33% | 49 | 16 | 0 | 2 | 0 | 0 |
| Horowitz Law, PLLC | 57 | 2.83% | 12 | 10 | 10 | 2 | 11 | 12 |
| ADA Legal Team, LLC | 48 | 2.38% | 11 | 3 | 0 | 9 | 10 | 15 |
| Mizrahi Kroub LLP | 45 | 2.23% | 9 | 5 | 7 | 9 | 8 | 7 |
| Alberto R. Leal, Esq. P.A. | 42 | 2.09% | 7 | 8 | 12 | 8 | 7 | 0 |
| Gabriel A. Levy, P.C. | 37 | 1.84% | 16 | 10 | 0 | 0 | 5 | 6 |
| Adams & Associates, P.A. | 36 | 1.79% | 4 | 7 | 5 | 5 | 9 | 6 |
| 16 Law Firms Filed 90.57% ADA Lawsuits From Jan to Jun 2025 | 1824 | 90.57% | 293 | 324 | 319 | 300 | 336 | 252 |
| 14 Law Firms Filed 9.43% ADA Lawsuits From Jan to Jun 2025 | 190 | 9.43% | 25 | 12 | 43 | 21 | 52 | 37 |
| 30 Law Firms Collectively Filed 2014 Lawsuits From Jan to Jun 2025 | 2014 | 100% | 318 | 336 | 362 | 321 | 388 | 289 |
Top 5 Plaintiff Firms
1,148 Cases – 57.00%
Top 10 Plaintiff Firms
1,559 Cases – 77.41%
Top 15 Plaintiff Firms
1,788 Cases – 88.78%
Key Highights:
Manning Law, APC emerged as the leading filer this year, accounting for over 14% of all lawsuits. Their continued dominance underscores their deep engagement with serial plaintiffs.
Close behind, Gottlieb & Associates and Equal Access Law Group, PLLC each filed more than 200 lawsuits, reinforcing the role of high-volume firms in shaping national ADA enforcement trends — whether through litigation or settlements.
New York-based and Florida-based firms like Stein Saks, PLLC and Roderick V. Hannah, Esq., P.A. also maintained significant activity.
Several mid-tier firms — including Aleksandra Kravets, Esq. P.A., Throndset Michenfelder Law Office, LLC, and AJG Law Group, PC — exhibited sharp growth in filing volume compared to the same period last year. Notably, AJG Law Group appears to be shifting its filing patterns, with most of its lawsuits emerging in Q2,
suggesting a strategic ramp-up possibly tied to new client intake or geographic expansion.
Interestingly, Asher Cohen PLLC demonstrated a flash pattern: an overwhelming bulk of its lawsuits were filed in January, with minimal activity thereafter. This raises the possibility of a targeted campaign or a batch-filing strategy rather than consistent monthly filings.
Attorney Michael H. Cohen has appeared in multiple cases as counsel for plaintiffs represented by both Asher Cohen PLLC and Equal Access Law Group PLLC. This overlap in representation suggests a collaborative legal strategy or affiliation between the two firms, contributing to their high lawsuit volume in 2025.
At the lower end of the filing spectrum, firms like Mizrahi Kroub LLP, Gabriel A. Levy, P.C., and Adams & Associates, P.A. contributed relatively few cases but still participated actively in what appears to be a growing network of niche ADA litigators.
While Mizrahi Kroub LLP appeared to contribute fewer federal filings during the first half of 2025, this may not indicate reduced activity. The firm has increasingly shifted to filing in state courts, where lawsuits are more difficult to track, potentially underrepresenting their actual volume of legal actions.
In addition to lawsuits, many law firms—especially those specializing in ADA litigation—are issuing demand letters that never make it into public court records. These letters pressure businesses into settlements without formal legal proceedings, making the true scale of ADA-related legal action significantly larger than reported numbers suggest.
Overall, the legal landscape remains largely unchanged in structure but shows signs of new firms gaining traction while established players deepen their presence. This concentration of lawsuits in the hands of a few firms raises ongoing concerns about forum shopping, settlement pressure tactics, and the long-term efficacy of litigation as a driver for meaningful digital accessibility improvements.
Industry Trends in ADA Website Lawsuits (Jan–Jun 2025)
The first half of 2025 highlights a concentrated targeting of specific industries, with just 10 sectors accounting for over 90% of all ADA website accessibility lawsuits filed. This continued trend reinforces the notion that certain industries remain prime targets for plaintiffs and law firms, likely due to the volume of online consumer interactions and inconsistent accessibility standards across digital storefronts.
| Industry Category | Total Lawsuits | Percentage | January | February | March | April | May | June |
|---|---|---|---|---|---|---|---|---|
| Restaurant, Food, Drinks & Beverages | 614 | 30.49% | 82 | 110 | 74 | 131 | 115 | 102 |
| Lifestyle, Fashion, Clothing & Apparel | 580 | 28.80% | 97 | 98 | 138 | 76 | 112 | 59 |
| Beauty, Skin & Body Care | 179 | 8.89% | 38 | 20 | 35 | 32 | 24 | 30 |
| Medical & Health | 144 | 7.15% | 13 | 22 | 37 | 21 | 34 | 17 |
| Furniture, Lighting, Home Decor & Kitchen | 106 | 5.26% | 20 | 20 | 18 | 10 | 20 | 18 |
| Fitness & Sports Accessories | 51 | 2.53% | 5 | 4 | 8 | 6 | 21 | 7 |
| Educational, Media, News & Magazines | 39 | 1.94% | 8 | 16 | 6 | 2 | 5 | 2 |
| Toys, Games, Gifts & Flower Shops | 38 | 1.89% | 12 | 8 | 6 | 4 | 4 | 4 |
| Computer, Mobile & Electronic Accessories | 37 | 1.84% | 12 | 3 | 2 | 7 | 6 | 7 |
| Equipment, Tools & Accessories | 37 | 1.84% | 6 | 6 | 8 | 3 | 7 | 7 |
| 10 Industries Faced 90.62% of Lawsuits From Jan to Jun 2025 | 1825 | 90.62% | 293 | 307 | 332 | 292 | 348 | 253 |
| 11 Industries Faced 9.38% of Lawsuits From Jan to Jun 2025 | 189 | 9.38% | 25 | 29 | 30 | 29 | 40 | 36 |
| Total ADA Website Lawsuits by Industry From Jan to Jun 2025 | 2014 | 100% | 318 | 336 | 362 | 321 | 388 | 289 |
Restaurants, Food, and Beverage brands topped the list, facing 614 lawsuits (30.49%), making it the most sued industry category. Given the industry’s reliance on menu-driven websites, online ordering systems, and third-party integrations, accessibility failures are not only common but also impactful for users with disabilities.
Lifestyle, Fashion, Clothing & Apparel businesses followed closely with 580 lawsuits (28.80%). As e-commerce continues to expand in this space, many brands have yet to implement inclusive design practices, leaving visually impaired users unable to navigate or complete purchases independently.
Together, Restaurants, Food & Beverage (30.5%) and Lifestyle & Apparel (28.8%) made up nearly 60% of all lawsuits, cementing their position as the most targeted sectors.
The Beauty, Skin & Body Care sector also saw a considerable number of cases (179 lawsuits), making up nearly 9% of all filings. This reflects increased digital engagement and frequent promotions that can make these websites complex and image-heavy — often leading to WCAG violations.
The Medical & Health industry, while regulated and expected to maintain higher accessibility standards, accounted for 144 lawsuits (7.15%), showing that even healthcare-related sites are not immune to litigation.
Categories like Furniture & Home Décor, Fitness & Sports Accessories, and Educational & Media sites each experienced between 1.8% to 5.2% of total lawsuits. These industries, though diverse in content, often suffer from issues such as improper labeling, untagged images, inaccessible PDF catalogs, or poorly structured content hierarchies.


What’s notable is that even low-volume sectors, like Computer & Electronic Accessories and Toys & Gifts, were not spared. This reinforces the increasing scope of ADA enforcement — suggesting that no industry is too small or niche to face legal action if its website fails to meet accessibility guidelines.
Overall, the data underscores the urgent need for businesses — especially those in high-risk industries — to prioritize accessibility audits and remediation. With over 2,000 lawsuits filed in just six months, this legal risk is far from hypothetical and continues to grow.
Common Reasons for ADA Website Lawsuits (Jan–Jun 2025)
Despite growing awareness around digital accessibility, many websites across industries still fail to comply with the Web Content Accessibility Guidelines (WCAG), leading to legal consequences. The most common accessibility barriers cited in ADA lawsuits during the first half of 2025 include:
Missing or Incorrect Image Alt Text
Inaccessible Forms and Checkout Processes
Keyboard Navigation Failures
Lack of Focus Indicators
Color Contrast Issues
Missing ARIA Labels and Landmark Roles
Improper Heading Structures
Inaccessible PDFs or Documents
Popups and Overlays Without Accessible Controls
Widget Usage Fails to Prevent ADA Lawsuits: 2025 Mid-Year Analysis
Despite having accessibility widgets installed, 456 ADA lawsuits were filed against websites, making up 22.64% of the total lawsuits. This emphasizes that simply adding an accessibility widget is not a comprehensive solution to web accessibility and compliance. A more thorough, proactive approach is necessary to ensure full ADA compliance.

Bar chart showing the number of ADA website lawsuits filed each month from January to June in 2025 (blue bars) and 2024 (red bars), specifically against websites with accessibility widgets installed. The data reveals an overall increase in lawsuits in 2025 compared to 2024.
Despite their widespread marketing as a “quick fix” for compliance, accessibility widgets continue to face legal scrutiny — and the data from the first half of 2025 further solidifies this trend.
The chart shows that lawsuits targeting websites using accessibility overlays or widgets have increased consistently each month compared to the same period in 2024. The most striking differences occurred in May (90 in 2025 vs. 59 in 2024) and June (80 in 2025 vs. 38 in 2024) — nearly doubling the number of cases. Even traditionally lower-activity months like January and April saw notable spikes.
This steady increase raises serious questions about the effectiveness and reliability of widget-based solutions, especially when they’re deployed without addressing core accessibility barriers in the website’s code or structure. Plaintiffs and their legal teams appear to be increasingly targeting websites that rely on these tools, reinforcing the growing awareness in legal circles that overlays often fail to provide meaningful access for users with disabilities.
The upward trend demonstrates that businesses can no longer rely solely on automated accessibility widgets to meet ADA and WCAG requirements. Instead, a comprehensive, code-based remediation approach remains the most defensible and inclusive strategy for achieving long-term compliance.
The trend is clear: overlays are not reducing litigation exposure. Instead, they may be painting a target on businesses relying on them as a shortcut.
FTC Settlement Undermines Widget “Quick Fix” Claims
The risks of relying on accessibility widgets were underscored in 2025 when the FTC reached a $1 million settlement with AccessiBe, one of the largest widget providers. Regulators found that the company had misled businesses by marketing its overlay product as a guaranteed ADA compliance solution, despite evidence that it left critical barriers in place for people with disabilities.
The settlement is a clear signal that regulators are scrutinizing “quick fix” solutions that overpromise and underdeliver. Businesses that rely solely on widgets not only remain exposed to lawsuits but now face potential regulatory action as well. Read our blog of the FTC’s settlement with AccessiBe.
ADA Website Lawsuits by Website Platform (Jan–Jun 2025)
With the increasing number of ADA lawsuits, the spotlight is on how websites are developed and maintained across various platforms. While CMS and e-commerce platforms like Shopify, WordPress, and others provide robust features, accessibility compliance largely depends on how these tools are configured and used by businesses—not on the platforms alone.
Custom Coded Websites
Led the chart with 691 lawsuits (34.31%). These are bespoke platforms often built without strict adherence to accessibility standards, making them highly vulnerable when not reviewed for compliance.
Lawsuits: 691
Percentage: 34.731%
Shopify
Followed closely, facing 653 lawsuits (32.42%). Despite being marketed as user-friendly, many Shopify stores lack proper accessibility configurations, particularly when merchants rely on third-party themes or apps that don’t meet WCAG guidelines.
Lawsuits: 653
Percentage: 32.42%
WordPress
Another popular platform, saw 403 lawsuits (20.01%). While it offers many accessibility plugins, the sheer number of themes and customization options can lead to inconsistent experiences for users with disabilities.
Lawsuits: 403
Percentage: 21.01%
Magento
With 113 lawsuits (5.61%), and Salesforce Commerce Cloud, with 94 lawsuits (4.67%), also featured on the list. These platforms often serve mid to large-scale enterprises, where accessibility may be deprioritized in complex builds.
Lawsuits: 113
Percentage: 5.61%
Squarespace
Known for ease of use among small businesses and creatives, faced 60 lawsuits (2.98%), indicating that simple drag-and-drop builders are not immune from compliance risks.
Lawsuits: 60
Percentage: 2.98%
This data underscores a key trend: no platform is automatically ADA compliant. Regardless of whether a business chooses a custom-coded solution or a popular CMS, accessibility must be a deliberate part of the development and maintenance strategy.
Global Trends in Digital Accessibility: 2025 Snapshot
As digital accessibility continues to gain attention across the U.S., other parts of the world are also stepping up their efforts — introducing new policies and regulations that affect both local and international organizations:
Los Angeles: Accessibility Commitment for 2028 Olympics
In preparation for the 2028 Summer Olympics, Los Angeles Mayor Karen Bass signed an executive directive committing the city to become fully accessible. The initiative spans infrastructure, transportation, and digital services — setting a global example for inclusive urban and digital planning. Source
European Accessibility Act (EAA)
Starting June 2025, the European Union will enforce the EAA, requiring digital products and services — including websites, e-commerce platforms, mobile apps, and self-service kiosks — to meet strict accessibility standards. This has major implications for U.S. businesses serving customers in the EU, especially if their digital offerings are not compliant with the new requirements. Non-compliance may result in regulatory action or exclusion from European markets. Source
The Netherlands: Stronger Consumer Protections via ACM
The Netherlands Authority for Consumers and Markets (ACM) continues to enforce regulations to ensure fair digital access and usability. Although not specific to ADA, their broader accessibility initiatives reflect Europe’s rising focus on inclusive design and digital equality. Source
India: SEBI Mandates Digital Accessibility in Financial Services
In a landmark move, India’s Securities and Exchange Board (SEBI) now requires regulated financial entities to ensure their digital platforms meet accessibility standards. This decision aims to promote inclusive finance, ensuring all individuals — including those with disabilities — can access investment platforms, trading services, and financial tools. Source
These developments signal a global shift toward accessibility as a legal requirement that could shape how the web is built. Businesses operating internationally or serving diverse audiences must stay informed and proactive to avoid risk and lead in digital inclusion.
ADA Title II Deadline:
Billions at Stake, One Year Away
The DOJ’s final rule under Title II of the ADA, requiring U.S. state and local governments to make their digital services conform to WCAG 2.1 AA, takes effect in April 2026. While positioned as a step forward, the rule risks locking public entities into guidelines first published over a decade ago — standards that were never widely adopted because of their complexity and limited real-world implementation.
Accessibility professionals, technologists, and business leaders share a common concern: that America may be forced to cling to carburetors in an era of electric cars.
Instead of preparing for the next generation of inclusive technology, agencies will be spending billions retrofitting outdated systems. Compliance is expected to cost taxpayers tens of billions of dollars, straining cities, counties, schools, and agencies already operating with limited resources.
The real danger is that this massive investment may not deliver meaningful improvements for people with disabilities. Outdated frameworks too often drive litigation rather than innovation. True accessibility means ensuring blind, low-vision, and disabled users can fully participate in today’s and tomorrow’s digital world — through AI-driven browsers, chatbots, wearables, and assistive technologies that are reshaping how people interact with information.
Unless the DOJ updates its approach, the 2026 deadline could push public entities into a cycle of lawsuits and settlements, while missing the chance to deliver real accessibility outcomes.
We urge regulators to revisit the rule and align it with the future — not the past — so taxpayer dollars fund inclusion, not inefficiency.

The Disconnect:
Yesterday’s Internet
vs. Tomorrow’s Accessibility
EcomBack observes a troubling trend: the global push to enforce WCAG 2.x standards — through the DOJ’s Title II rule in the U.S. and similar regulations worldwide — risks anchoring accessibility to outdated, overly complex frameworks. These standards, while important in their time, were never widely adopted because they are difficult for most organizations to implement consistently.
At the same time, the internet is rapidly evolving. AI browsers, chatbots, and wearables such as Meta’s Ray-Ban smart glasses and Be My Eyes are reshaping how users with disabilities interact with digital content.
Accessibility in 2026 will not be about retrofitting static web pages from 2016; it will be about designing inclusive systems that leverage AI, automation, and multimodal devices.
Attempting to remediate the entire “old internet” under WCAG 2.x is not only impractical, it risks locking businesses, governments, and taxpayers into a cycle that fuels litigation instead of progress. True digital inclusion requires forward-looking frameworks that align with the technologies shaping tomorrow — not backward-looking rules that promote serial litigation.

Conclusion
Conclusion The first half of 2025 saw 2,014 ADA website lawsuits — a 37% increase from 2024 — confirming that the very profitable niche of disability rights litigation is accelerating, spreading across more states, industries, and platforms.
A handful of serial plaintiffs and firms still drive most cases, while high-risk industries like restaurants and apparel remain prime targets.
With the DOJ’s Title II deadline less than a year away, the stakes are rising: public agencies face billions in compliance costs under outdated WCAG 2.1 AA guidelines. Clinging to WCAG 2.1 in 2026 is like enforcing dial-up internet in the age of 5G.
The lesson is clear — quick fixes like widgets won’t prevent lawsuits. Real progress requires a mix of code-level accessibility, forward-looking standards that match today’s fast-paced technology, and a notice-to-cure for legacy systems to be improved.
About EcomBack
EcomBack is a leading digital accessibility consultancy dedicated to helping businesses and public agencies navigate ADA compliance through audits, remediation, and strategic advocacy. Beyond client services, EcomBack publishes the most granular, openly available data on ADA website accessibility lawsuits in the industry.
Our reports provide raw lawsuit data, carefully analyzed to inform lawmakers, the judiciary, businesses, and the disability rights community a clear view of the state of ADA website litigation.
Our mission is to push the conversation beyond litigation and toward true digital inclusion by making the legal landscape more transparent, accessible, and actionable for all stakeholders.

EcomBack’s Accessibility Solutions

Remediation

Accessibility Audits
We conduct thorough, human-led accessibility audits that go beyond automated tools. Options include monthly, quarterly, bi-annual, and annual audits to detect and resolve new issues promptly, keeping your website ADA-compliant.

Ongoing Monitoring

Staff Training

Accessibility Statements

Usability Testing
EcomBack helps businesses and public entities make the web accessible for people with disabilities.
Disclaimer: The contents of this report are provided for informational purposes only. The data and insights presented are based on our observations and interpretations, and while we strive for accuracy, we cannot guarantee the completeness or reliability of the information. For detailed terms and conditions regarding our content, please refer to our Website Content Disclaimer. Website Content Disclaimer.


